Figuring out client priorities is a key part of application development. It’s not an easy task. Here at Radial we’ve developed a web application to help us do this better
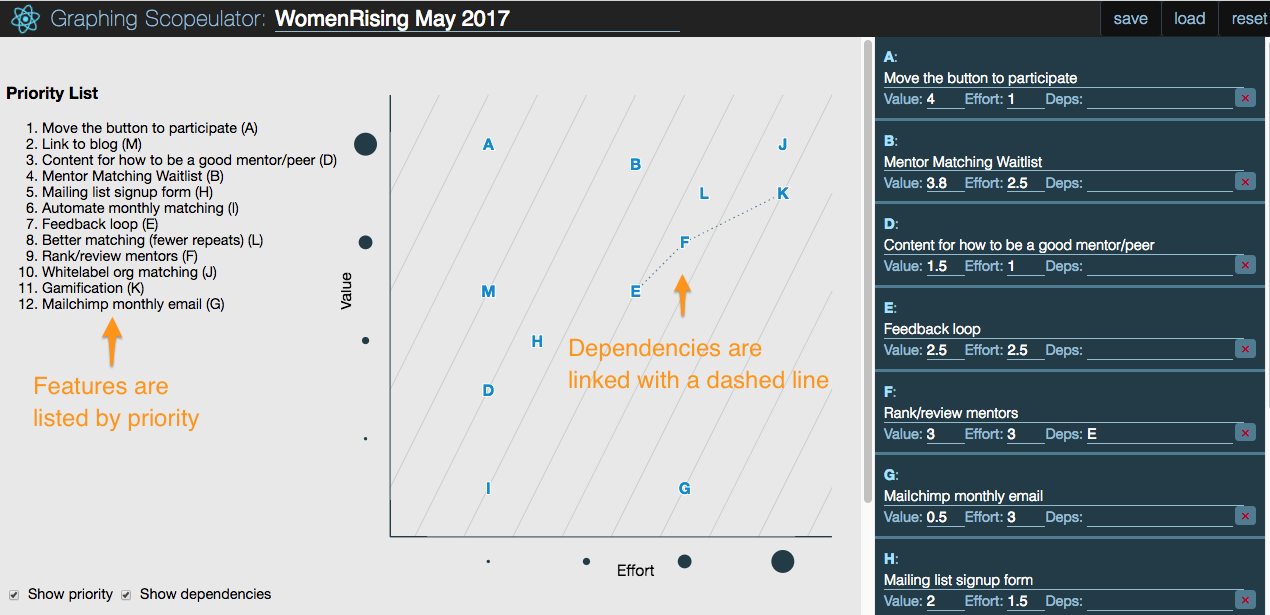
Our working name for the app we developed is the “Graphing Scopeulator.” We named it that because it allows us to graphically scope our projects collaboratively with clients.
Born Out Of Client Discovery
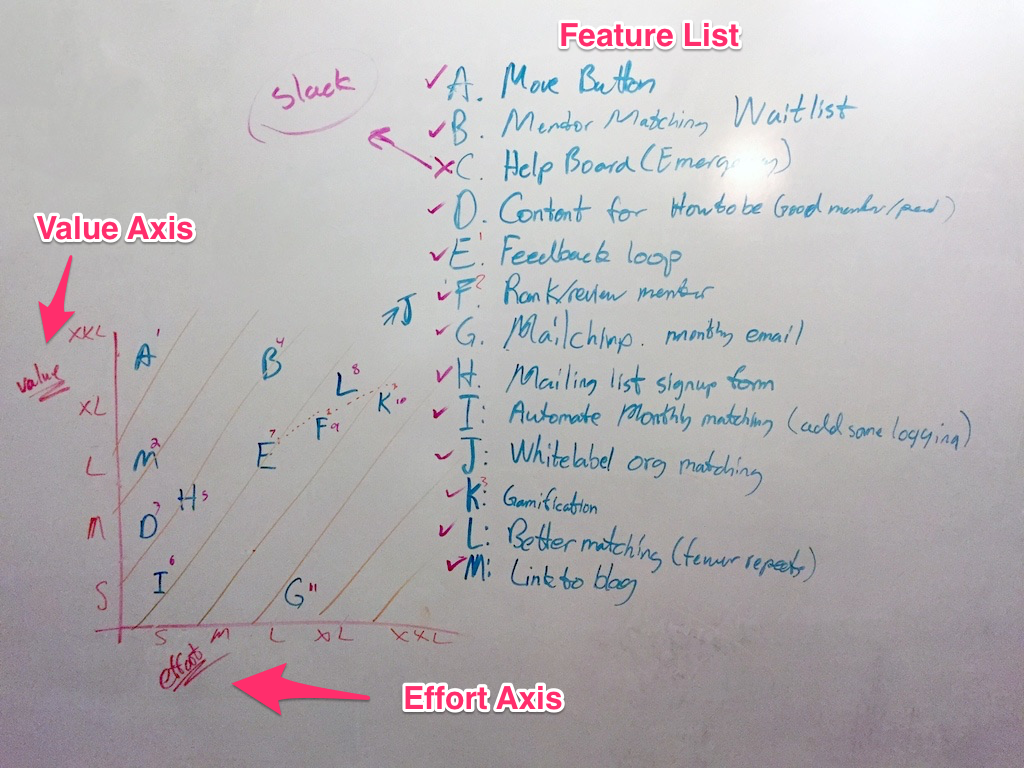
The Graphing Scopeulator was born out of a meeting I had with Kate Catlin, founder of WomenRising, an open source project that I regularly work on. I was planning several hack nights for the project, and I needed to know how to prioritize work on features that would move the effort forward. Just like I would do with any client, I invited Kate to the office to discuss her vision for WomenRising with me and another Radial developer, Marshall Smith.
Once we had captured a list of the features she wanted, Marshall started drawing a graph on the board. He asked Kate to rank each of the listed features by value. That became the graph’s vertical Y-axis. Then, we ranked the estimated time for us as developers to complete each item. That became the horizontal X-axis.

By graphing client priority against estimated difficulty for completion, the graph revealed the items that we could complete quickly that also had a high priority for Kate (the low-hanging fruit).
It also visually displayed which items were a lower priority or would take longer. Seeing the graph completely changed how Kate viewed the work on the project. “Now I understand why some items are getting done before others,” she told us.
Building A Flexible Scoping App That Works For All Clients
We loved how the graph helped us prioritize features and helped Kate, understand their priority. So we decided we wanted to use this for all our clients.
Since we’re a software development shop, we transformed it into an app, of course!
Marshall, our React wizard, built the working prototype in about two hours. It took about another full day’s work to get it into its current form.
We now use the Graphing Scopeulator with our new and current clients. We have even been able to use it again with WomenRising. Once we completed about half the items on the first graph, we met and completed the scoping activity again. This time we used the app. This allowed us to make sure we were still on track with Kate’s goals and values.

Going through the scoping process with clients allows them to to dream big, but at the end of the meeting see what needs to be accomplished before we can build the app of their dreams.
Collaboratively developing a visual display of their features along with our time estimations helps us jointly arrive at a realistic scope of work. Clients can visually see that their dreams are possible, but also understand that other features more basic to the project need to and will come first.
We’re still working on refining the Graphing Scopeulator. So far, it’s been a great tool to better understand client priorities and help them understand how a project will progress.
